How to Graph Super Enhancers
To illustrate gTrack’s capability in exploring data sets such as ChIP-Seq data as well as reading BigWig data sets. This entire vignette attemps to replicate Zhang, X. et al (2016) which identified focally amplified super enhancers in epithelial cancers.
## The methods section of http://www.nature.com/ng/journal/v48/n2/full/ng.3470.html stated
## that GISTIC (used to find copy number variations) analyses were performed on available TCGA data
## TCGA data was found on the TCGA copy number portal which is created by the Broad Institute of
## MIT and Harvard.

## After finding version 3.0 of the SNP pipeline on 22 October 2014, clicking on the IGV
## session returned an XML document (http://portals.broadinstitute.org/tcga/gisticIgv/session.xml?analysisId=21&tissueId=548&type=.xml)
## which stored the web path to the *.seg.gz file. I downloaded that and found
## that it stored the log2 ratios (tumor coverage / normal coverage).

## wget http://www.broadinstitute.org/igvdata/tcga/tcgascape/141024_update/all_cancers.seg.gz
## wget http://www.broadinstitute.org/igvdata/tcga/tcgascape/141024_update/sample_info.txt

## gzip -d all_cancers.seg.gz
Using dt2gr (gUtils) and y.field (gTrack) and gr.colorfield and colormaps
##############################                         ##############################

##############################    Starting Analysis    ##############################

##############################                         ##############################

library(gTrack) ## main sauce.
library(gUtils) ## for dt2gr

## Load coverage data into data.table. Very fast, thanks data.table.
## seg_data <- fread('../../inst/extdata/files/all_cancers.seg')

seg_data[Log2.Ratio <= 0, data_sign := "deletion"]
seg_data[Log2.Ratio > 0, data_sign := "insertion"]

## Coerce into GRanges from data.table because gTrack operates on GRanges.
seg_ranges <- dt2gr(seg_data)

## first glimpse (gotta know what the data looks like). Probably should zoom in before even starting.
## if you want the colors to be chosen automatically.
plot(gTrack(seg_ranges, y.field = 'Log2.Ratio', gr.colorfield = 'data_sign'))
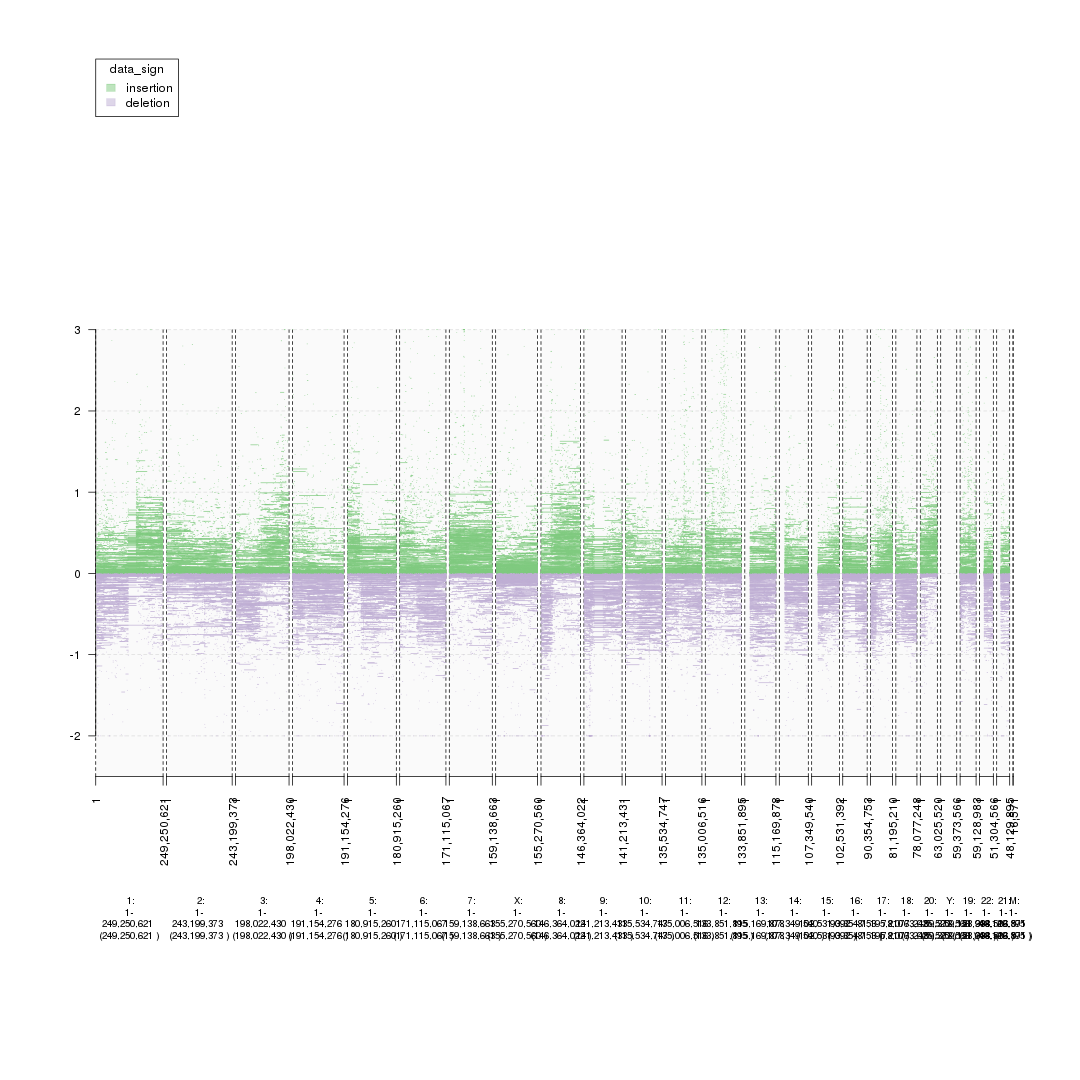
plot of chunk starting_analysis_plot
## if you want to manually set the colors. Better because red/blue can be chosen instead of some random colors.
plot(gTrack(seg_ranges, y.field = 'Log2.Ratio', colormaps = list('data_sign' = c(insertion = "blue", deletion = "red"))))
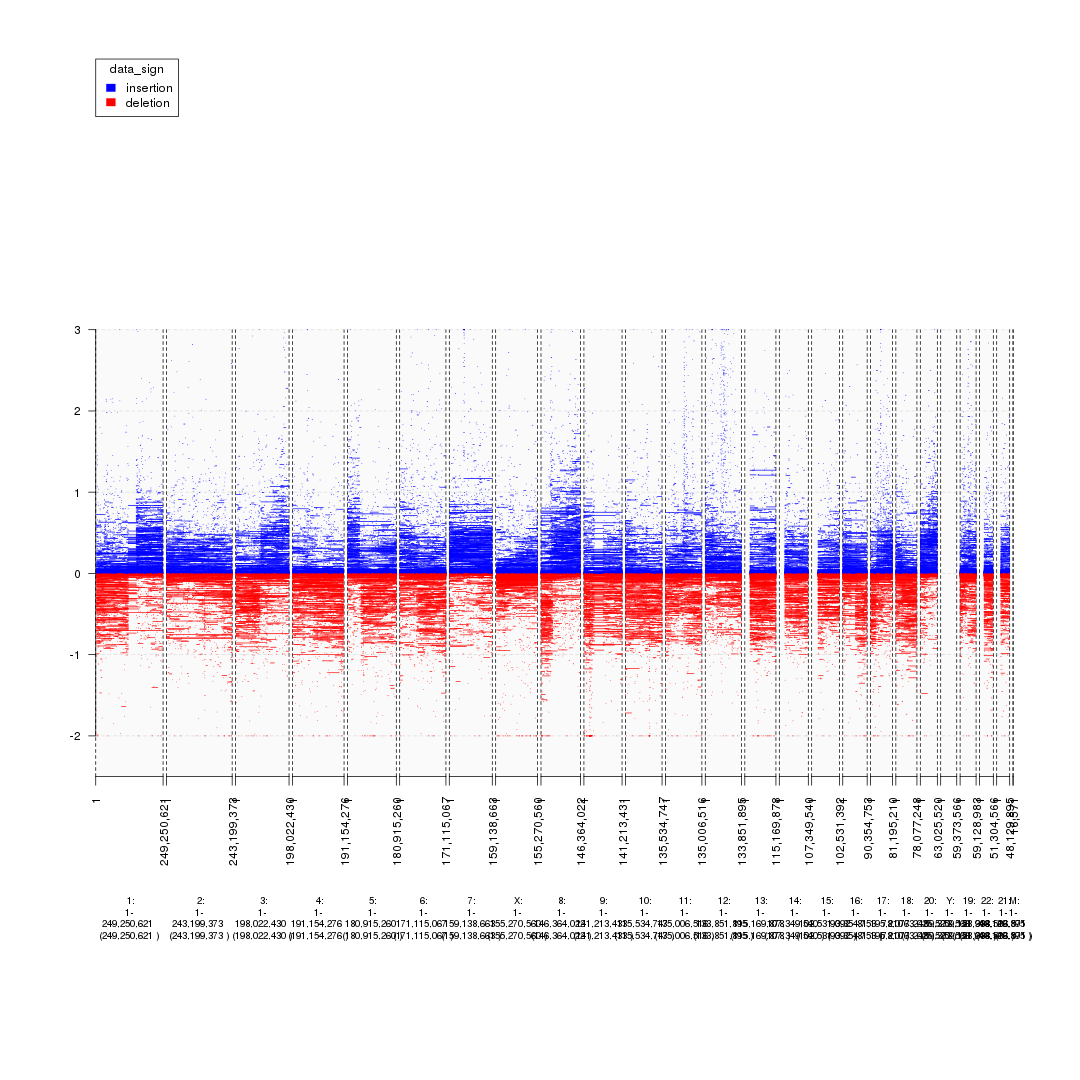
plot of chunk starting_analysis_plot2
## Subset to MYC enhancer amplification regions.
seg_data_chrom8 <- seg_data[ Chromosome == 8]

## coerce into GRanges from data.table because gTrack operates on GRanges.
seg_ranges_chrom8 <- dt2gr(seg_data_chrom8)
## if you want to manually set the colors. Better because red/blue can be chosen instead of some random colors.
plot(gTrack(seg_ranges_chrom8, y.field = 'Log2.Ratio', colormaps = list('data_sign' = c(insertion = "blue", deletion = "red"))), win = seg_ranges_chrom8)
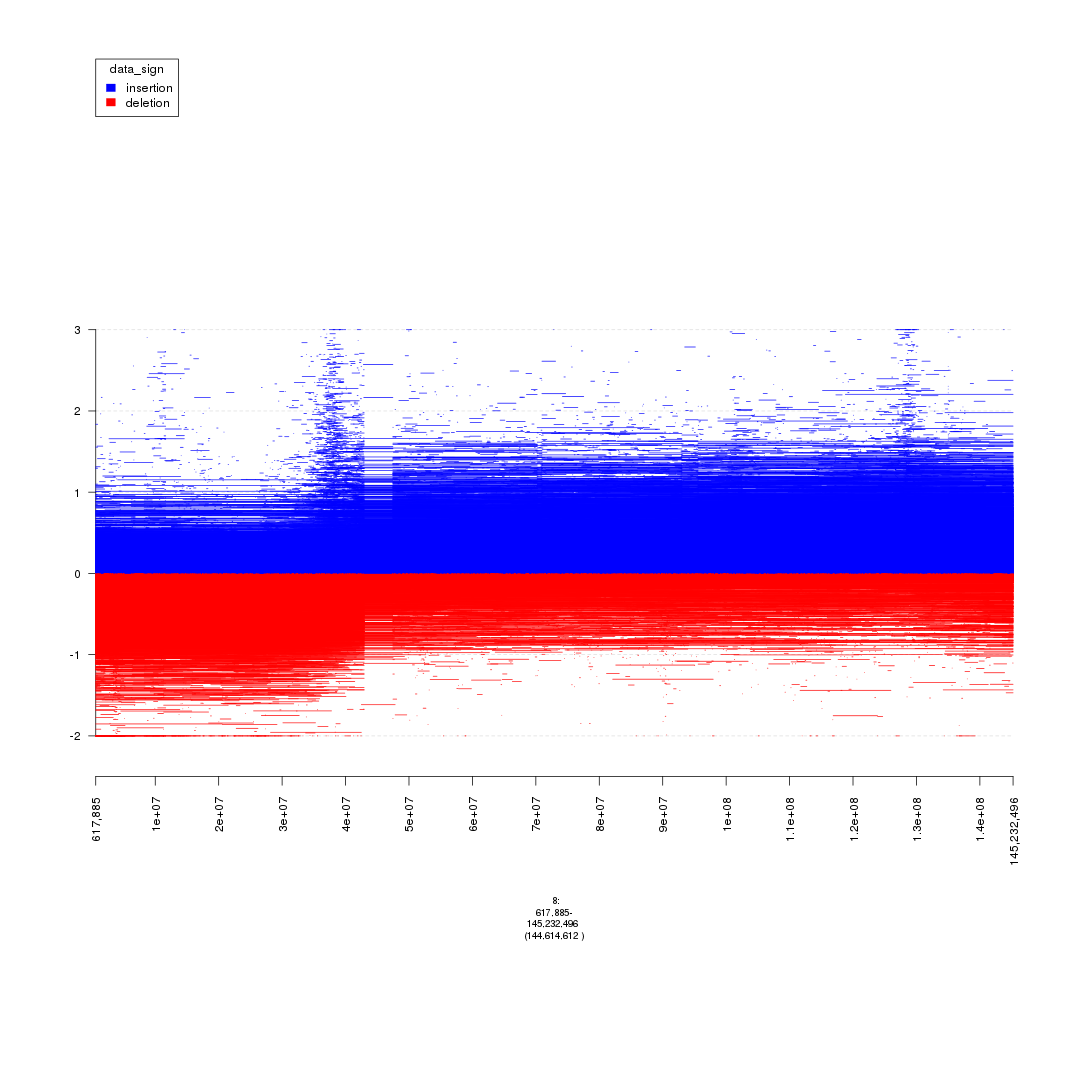
plot of chunk starting_analysis_plot3
Using parse.gr (gUtils)
##############################                         ##############################

##############################    Plot MYC Enhancers   ##############################

##############################                         ##############################

## first MYC(myc) (s)uper-(e)nhancer.
myc_se <- parse.gr(c('8:129543949-129554294'))
## zoom into that region to view CNA.
win <- myc_se
plot(gTrack(seg_ranges_chrom8, y.field = 'Log2.Ratio', colormaps = list('data_sign' = c(insertion = "blue", deletion = "red"))), win)
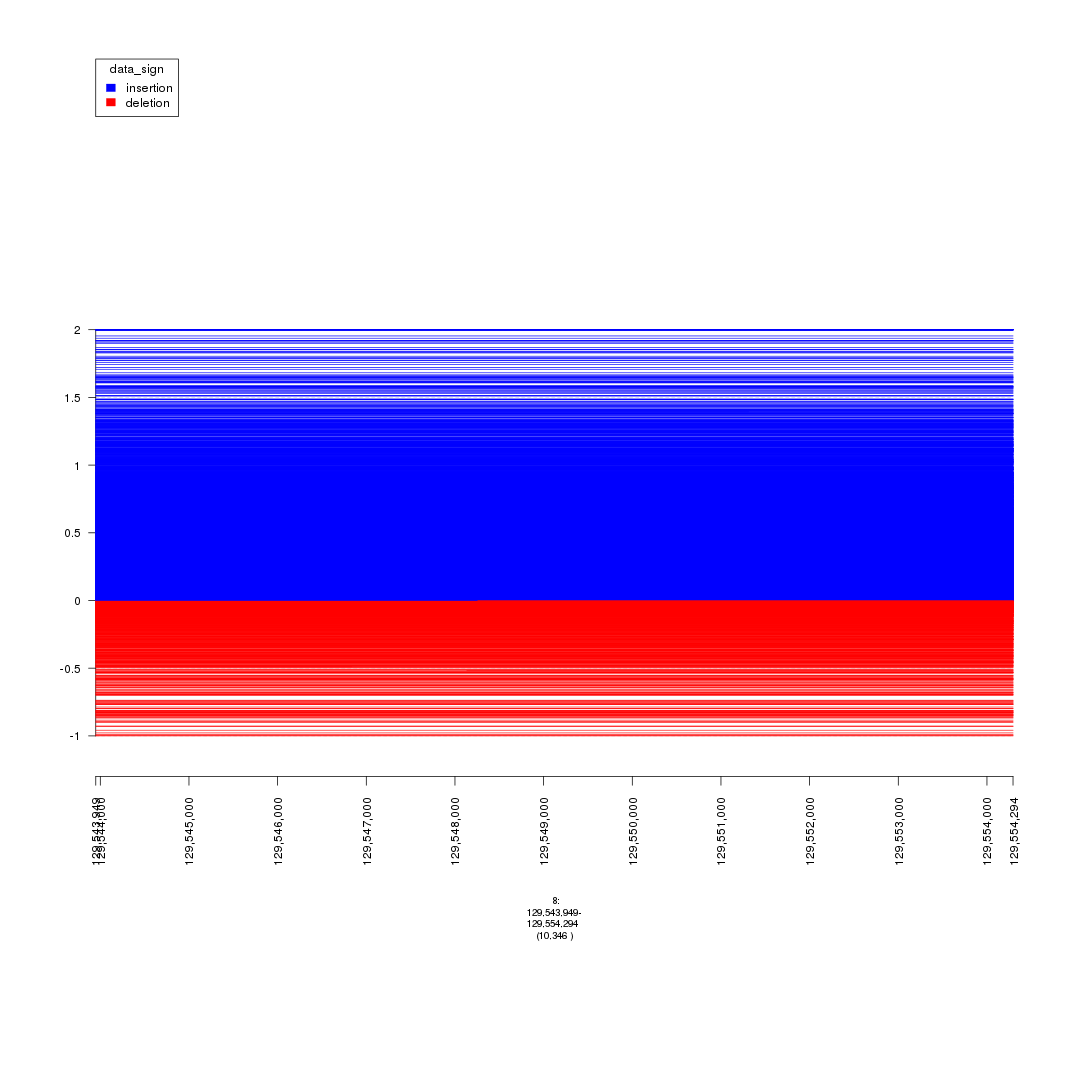
plot of chunk plot_MYC_enhancers
## second MYC super-enhancer
myc_se <- parse.gr(c('8:129166547-129190290'))
win <- myc_se
plot(gTrack(seg_ranges_chrom8, y.field = 'Log2.Ratio', colormaps = list('data_sign' = c(insertion = "blue", deletion = "red"))), win)
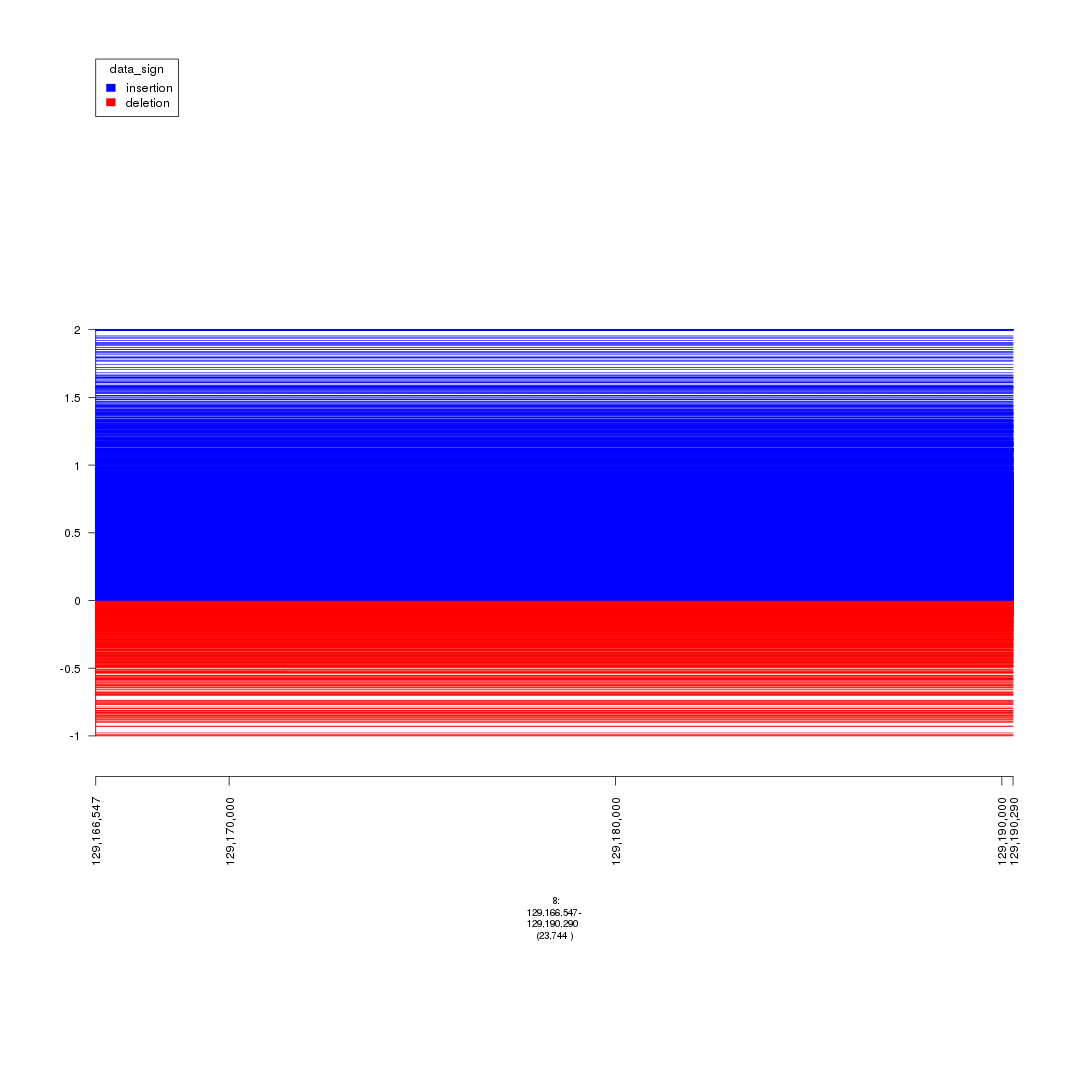
plot of chunk plot_MYC_enhancers
## it looks like both regions have focal insertions and deletions.
plot(gTrack(seg_ranges_chrom8, colormaps = list('data_sign' = c(insertion = "blue", deletion = "red"))), win = seg_ranges_chrom8+10e6)
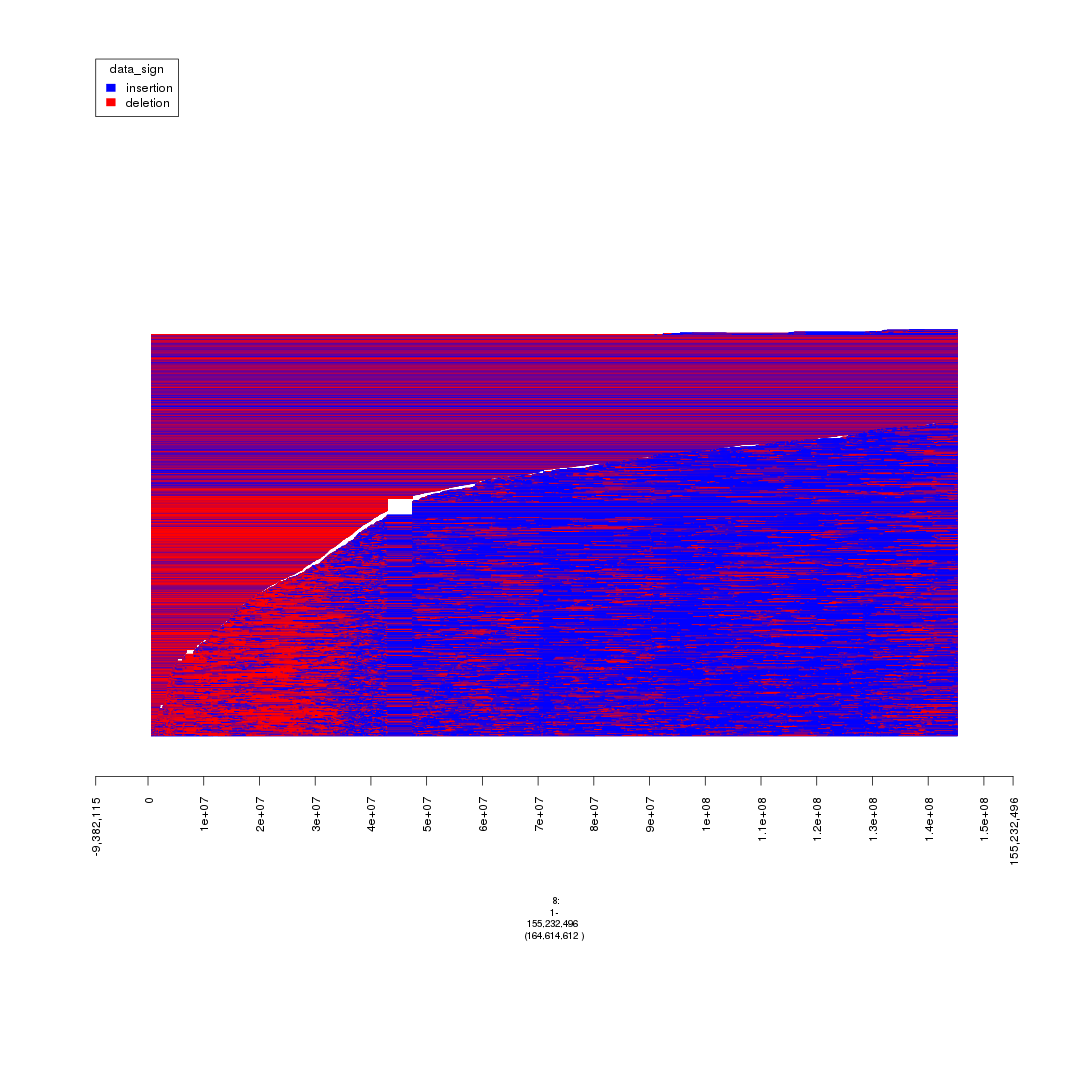
plot of chunk plot_MYC_enhancers
##############################                         ##############################

##############################    Setting Thresholds   ##############################

##############################                         ##############################

## max width is not 50 MB (actually 30KB) to remove very broad copy number changes.
## min width is not 20KB to exclude artifacts.

seg_data_chrom8 <- seg_data_chrom8[End.bp - Start.bp <= 30e3]
seg_ranges_chrom8 <- dt2gr(seg_data_chrom8)
plot(gTrack(seg_ranges_chrom8, colormaps = list('data_sign' = c(insertion = "blue", deletion = "red"))), win = seg_ranges_chrom8+10e6)
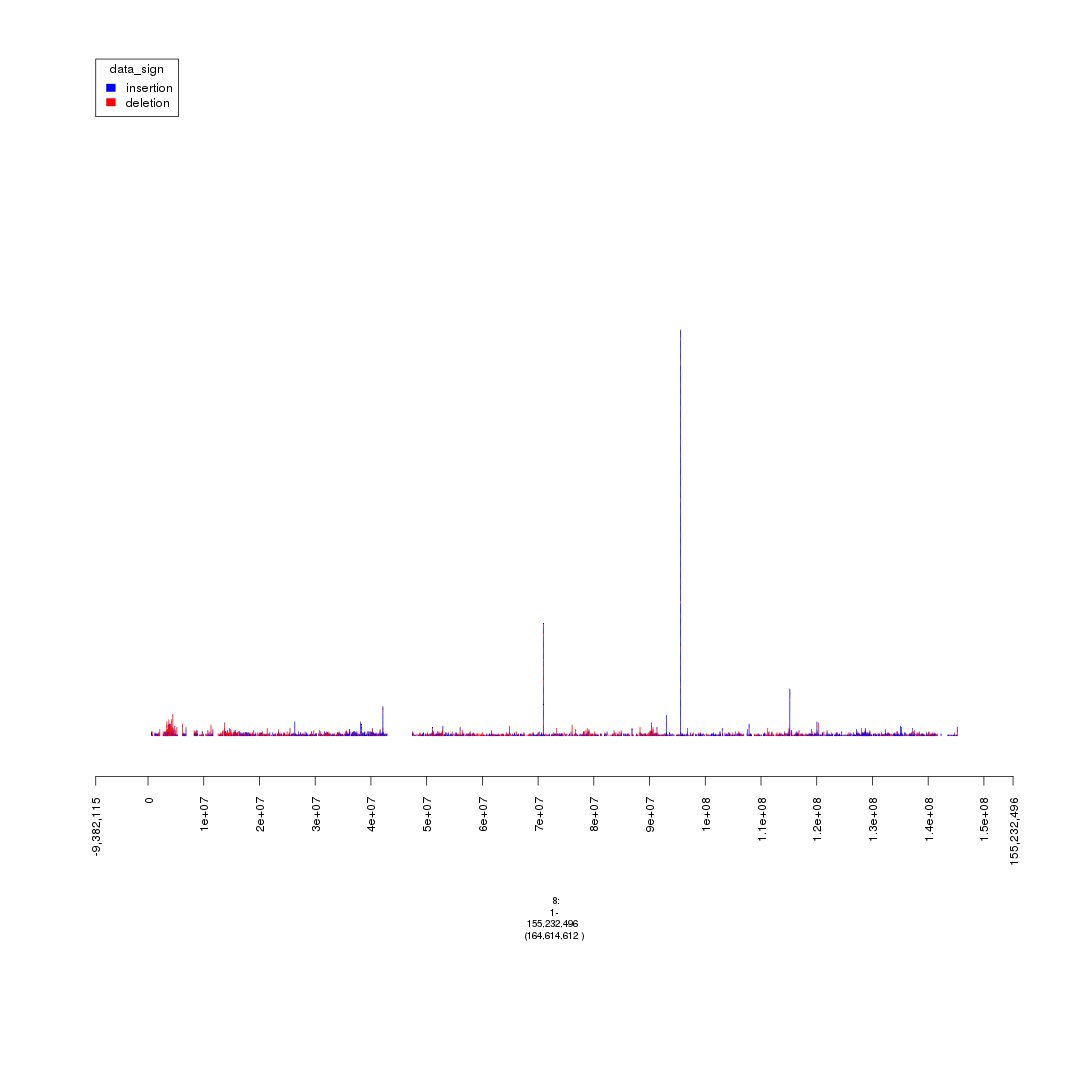
plot of chunk setting_thresholds
## explore data set for determining threshold for log2 ratio.

##############################                         ##############################

##############################       Random Fact       ##############################

##############################                         ##############################

## There are more insertions than deletions.
sorted_ratios <- sort(seg_data_chrom8$'Log2.Ratio')
length(sorted_ratios)
## [1] 4458
#### -1 and 2
seg_data_chrom8_2 <- seg_data_chrom8[Log2.Ratio >= -1 & Log2.Ratio <= 2]
seg_ranges_chrom8_2 <- dt2gr(seg_data_chrom8_2)

plot(gTrack(seg_ranges_chrom8_2, colormaps = list('data_sign' = c(insertion = "blue", deletion = "red"))), win = seg_ranges_chrom8_2+10e6)
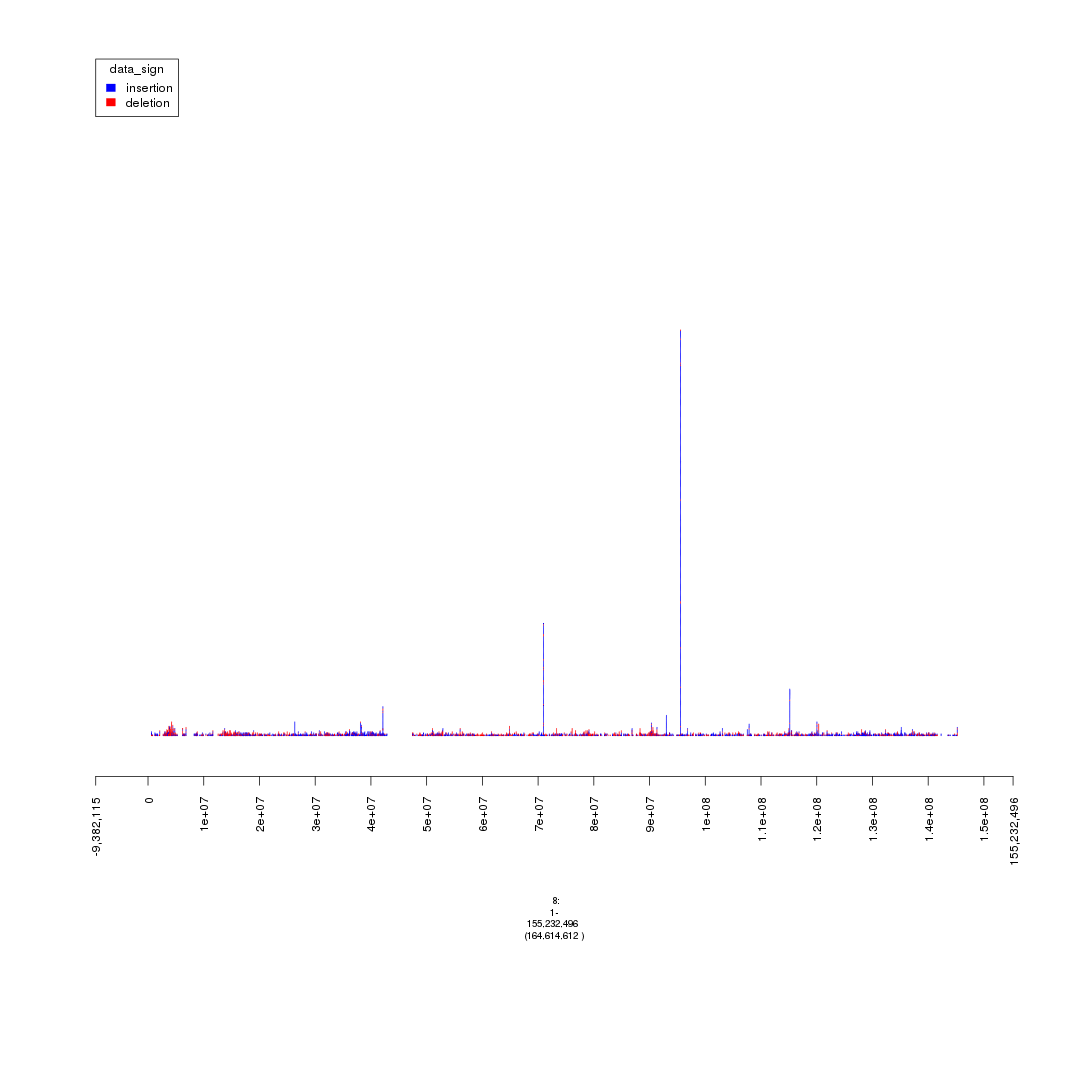
plot of chunk random_fact
#############################                          ################################
             # Not much of a change, will ignore setting thresholds for Log2.Ratio
############################                           ################################
Reading bigWig in gTrack
## bigWig downloaded from https://www.encodeproject.org/experiments/ENCSR000AUI/

## fold change.
plot(gTrack('~/my_git_packages/super_enhancers/db/ENCFF038AQV.bigWig'), win = parse.gr('8:128635434-128941434'))
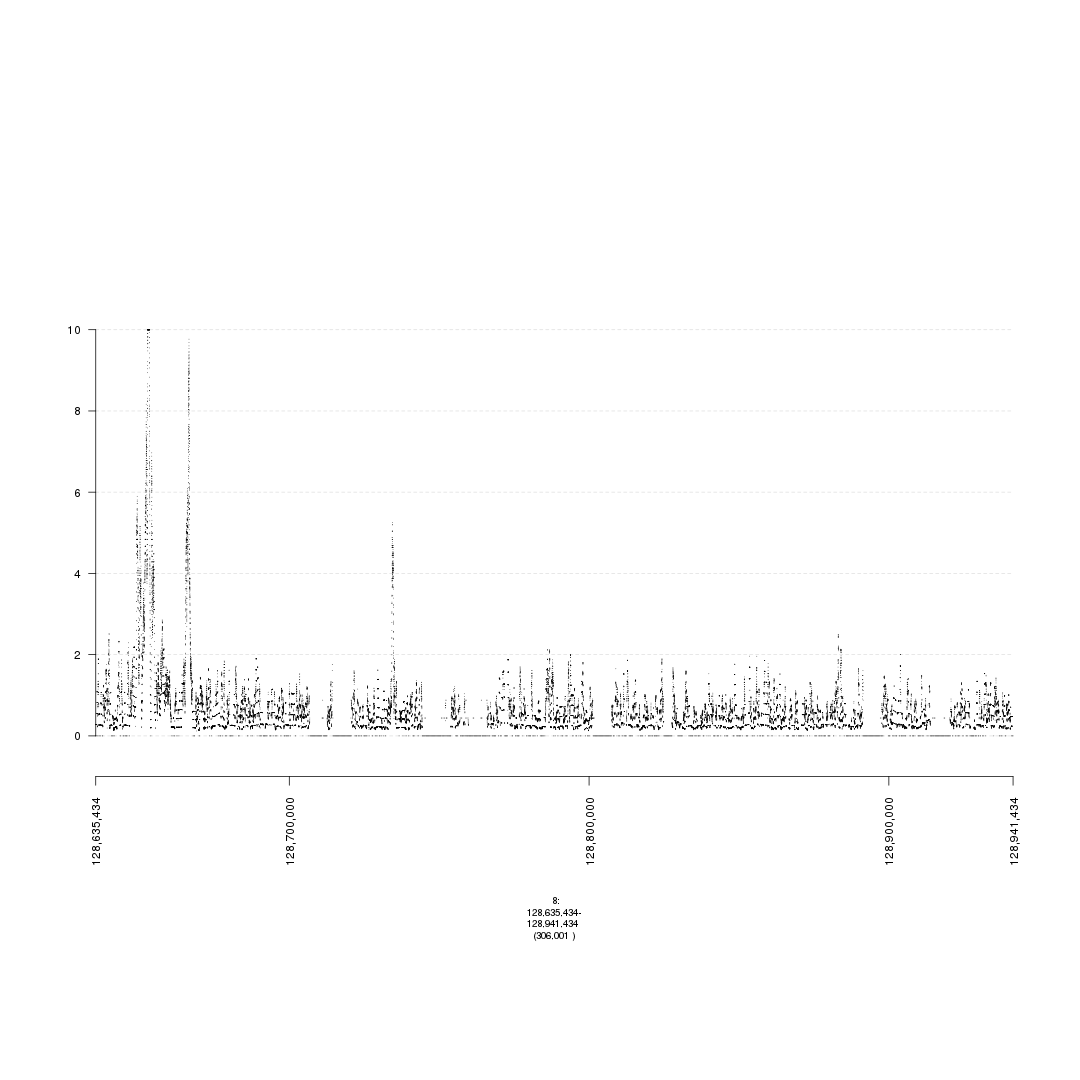
plot of chunk bigWig
### store gencode genes.
ge = track.gencode()
## Pulling gencode annotations from /gpfs/commons/groups/imielinski_lab/lib/R-3.3.0/gTrack/extdata/gencode.composite.collapsed.rds
### Plot ENCODE, peak super-enhancer, and copy number data.
### without super-enhancers.

plot(c(gTrack('~/my_git_packages/super_enhancers/db/ENCFF038AQV.bigWig', color = 'green'), gTrack(seg_ranges_chrom8, colormaps = list('data_sign' = c(insertion = "blue", deletion = "red"))), ge), win = parse.gr('8:128635434-128941434'))
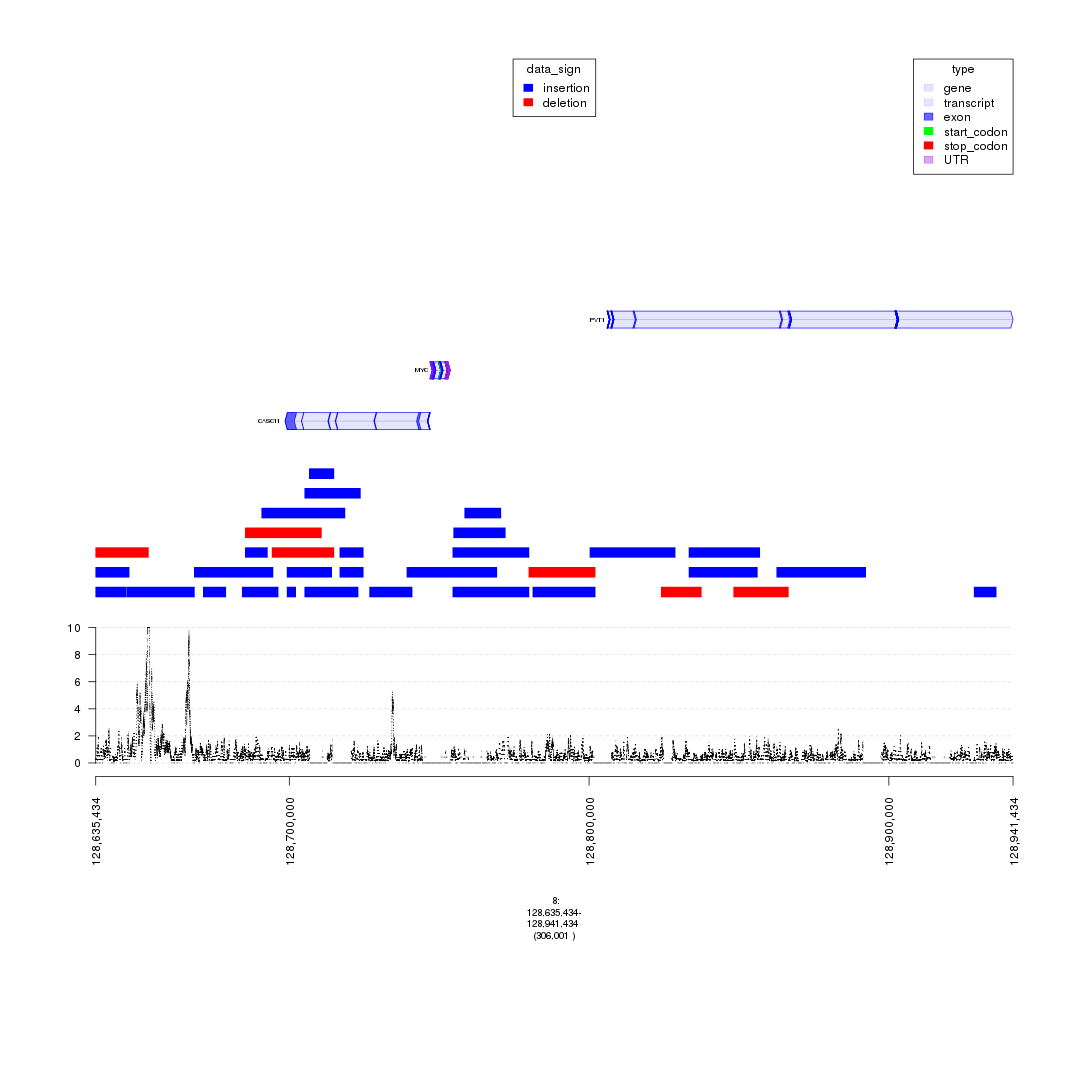
plot of chunk bigWig
### plotting regions witout super-enhancers.
plot(c(gTrack('~/my_git_packages/super_enhancers/db/ENCFF038AQV.bigWig', color = 'green', bar = TRUE), gTrack(seg_ranges_chrom8, colormaps = list('data_sign' = c(insertion = "blue", deletion = "red"))), ge), win = parse.gr('8:128735434-129641434'))
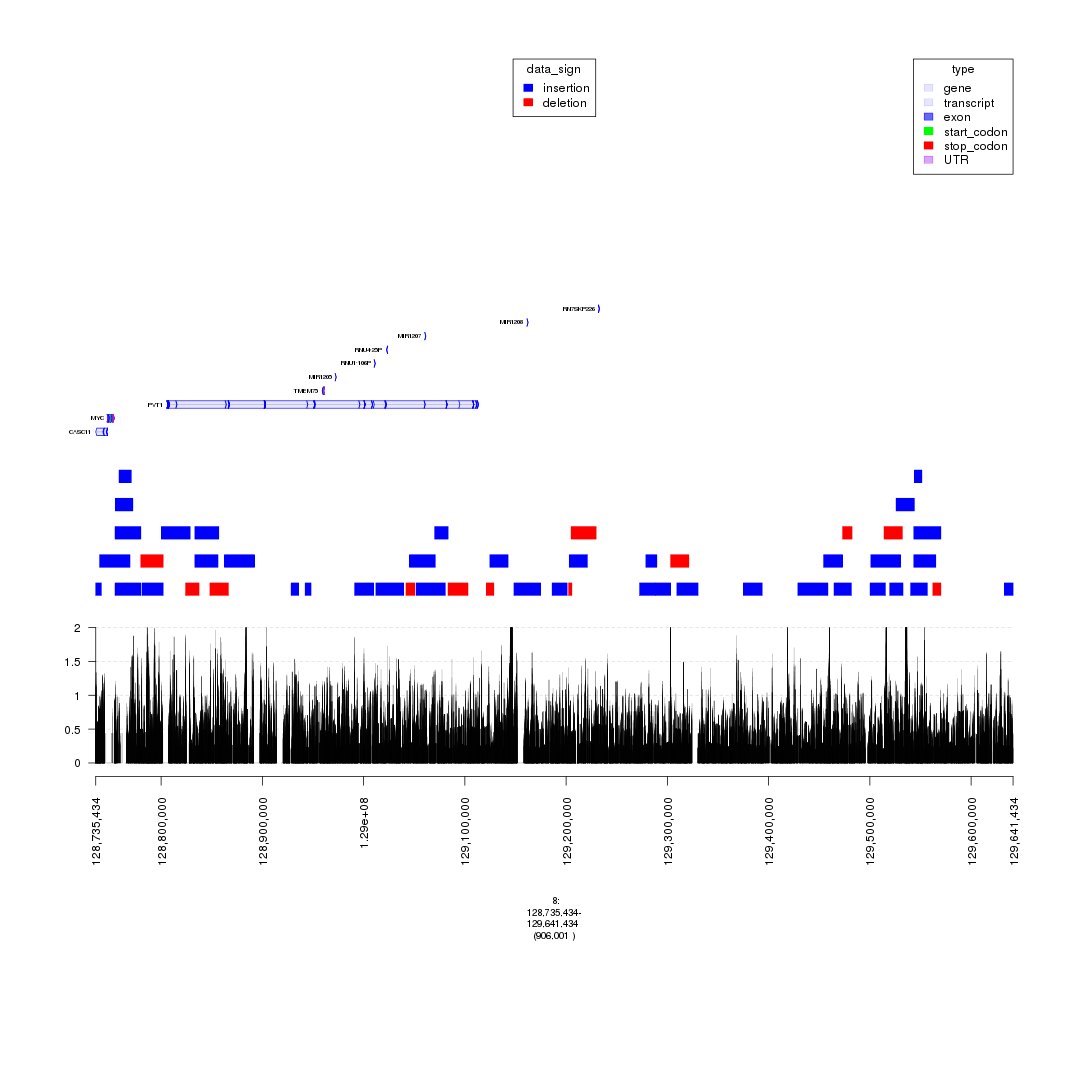
plot of chunk bigWig
### Split the copy number data into two objects - one for insertions & other for deletions.
seg_data_chrom8_insertions <- seg_data_chrom8[data_sign == "insertion"]
seg_data_chrom8_deletions <- seg_data_chrom8[data_sign == "deletion"]
seg_ranges_chrom8_insertions <- dt2gr(seg_data_chrom8_insertions)
seg_ranges_chrom8_deletions <- dt2gr(seg_data_chrom8_deletions)
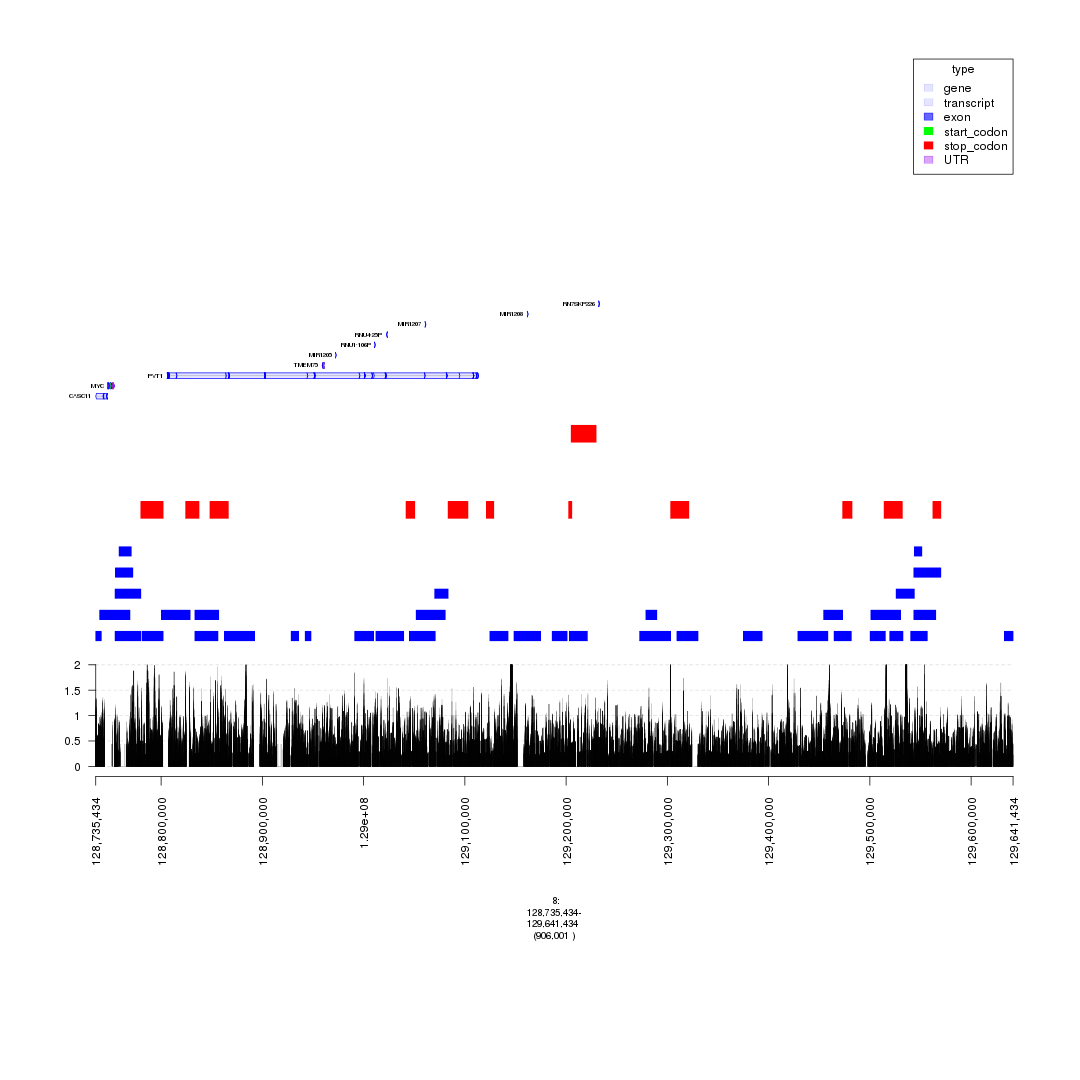
### with super-enhancers & gencode & ChIP-seq & insertions/deletions split.
plot(c(gTrack('~/my_git_packages/super_enhancers/db/ENCFF038AQV.bigWig', bar = TRUE), gTrack(seg_ranges_chrom8_insertions, col = "blue"), gTrack(seg_ranges_chrom8_deletions, col = "red"), ge), win = parse.gr('8:128735434-129641434'))
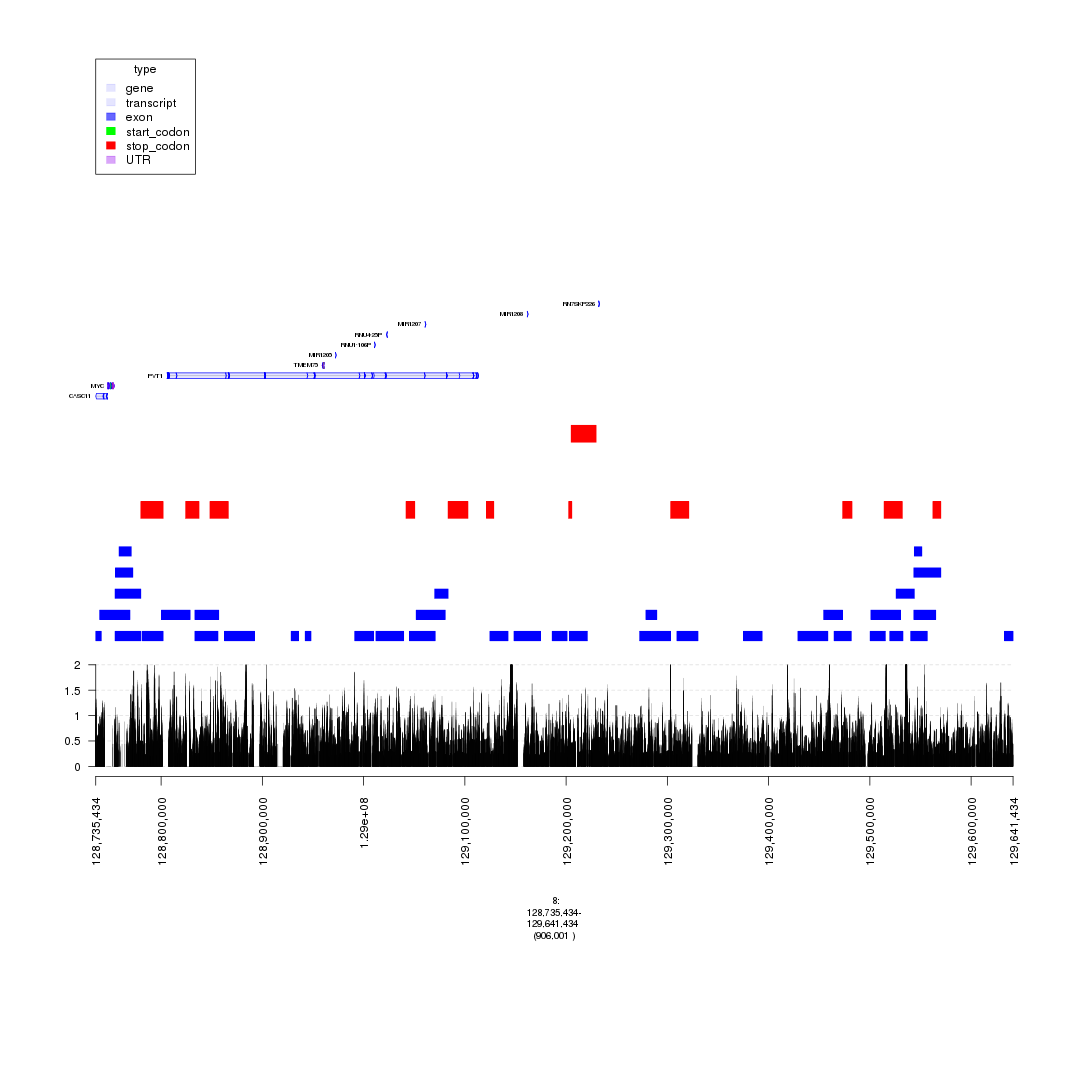
plot of chunk bigWig
## view the density of insertions.
plot(gTrack(seg_ranges_chrom8_insertions, y.field = "Log2.Ratio", col = "blue"), win = parse.gr('8:128735434-129641434'))
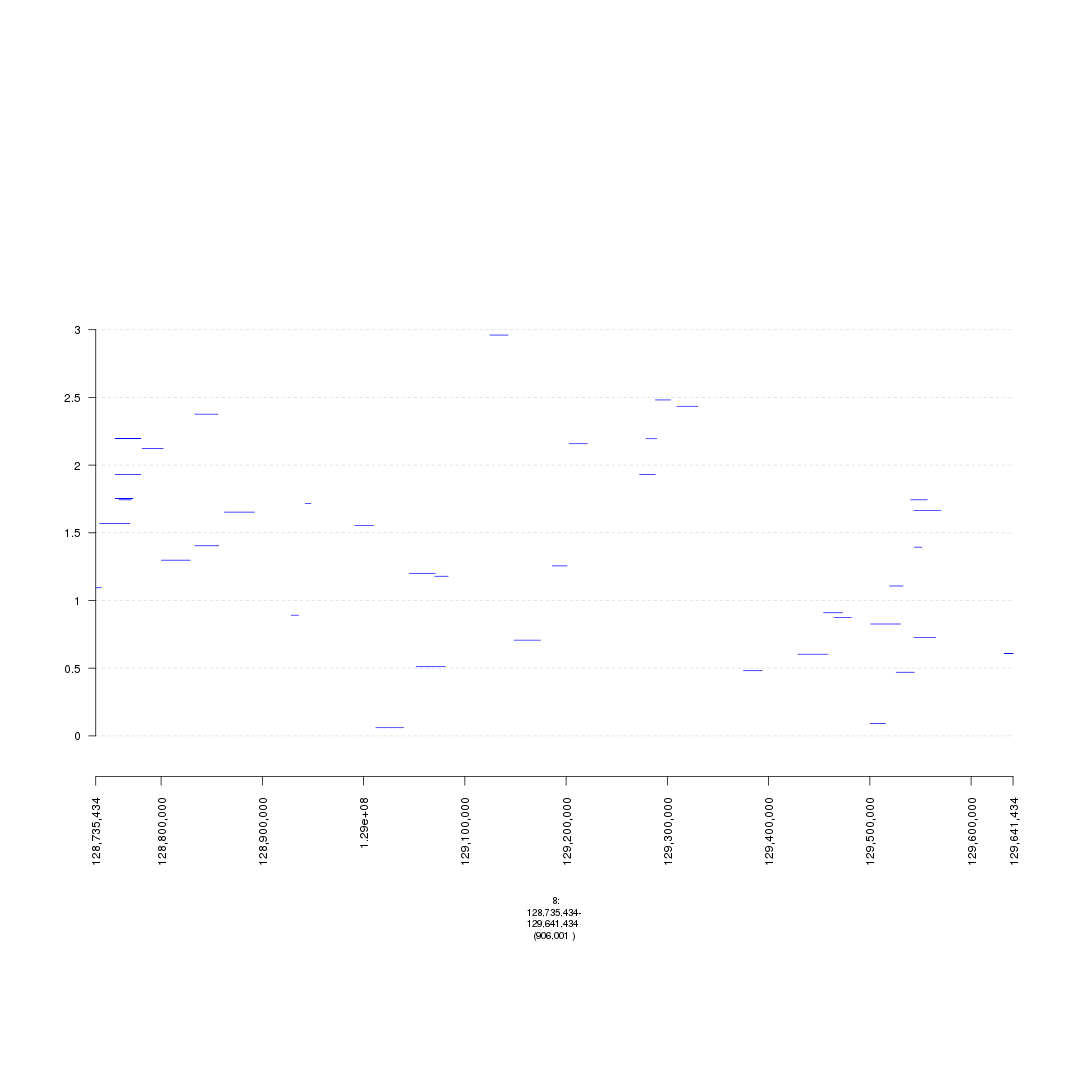
plot of chunk bigWig
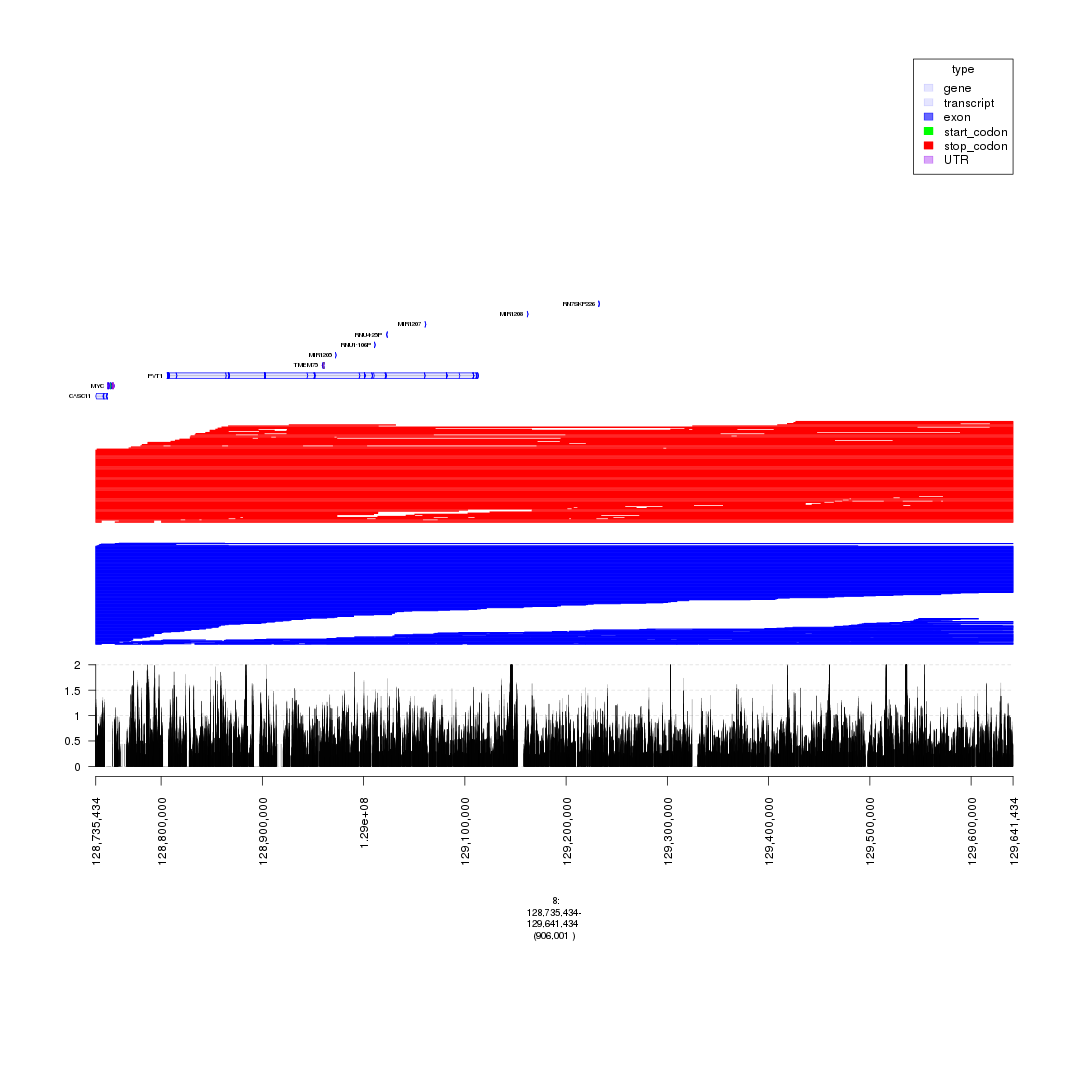
### Filtering broad events
seg_data_chrom8_deletions2 <- seg_data_chrom8_deletions[Log2.Ratio >= -0.6]
seg_data_chrom8_insertions2 <- seg_data_chrom8_insertions[Log2.Ratio >= 0.6]

seg_ranges_chrom8_insertions <- dt2gr(seg_data_chrom8_insertions)
seg_ranges_chrom8_deletions <- dt2gr(seg_data_chrom8_deletions)

plot(c(gTrack('~/my_git_packages/super_enhancers/db/ENCFF038AQV.bigWig', color = 'green', bar = TRUE), gTrack(seg_ranges_chrom8_insertions, col = "blue"), gTrack(seg_ranges_chrom8_deletions, col = "red"), ge), win = parse.gr('8:128735434-129641434'))
plot of chunk filter_broad_events
### Replicable pipeline

## Subset to MYC enhancer amplifications regions.
seg_data_chrom8 <- seg_data[ Chromosome == 8]
## coerce data.table into GRanges because gTrack operates on GRanges.
seg_ranges_chrom8 <- dt2gr(seg_data_chrom8)

## max width is 10MB.
seg_data_chrom8 <- seg_data_chrom8[End.bp - Start.bp <= 10e6]

seg_data_chrom8_deletions <- seg_data_chrom8[Log2.Ratio <= 0, data_sign := "deletion"]
seg_data_chrom8_insertions <- seg_data_chrom8[Log2.Ratio > 0, data_sign := "insertion"]


seg_data_chrom8_insertions <- seg_data_chrom8[data_sign == "insertion"]
seg_data_chrom8_deletions <- seg_data_chrom8[data_sign == "deletion"]

gray = 'gray20'
gt.h3k36 = gTrack('~/DB/Roadmap/consolidated//E114-H3K36me3.pval.signal.bigwig', name = 'H3K36me3', bar = TRUE, col = gray)
gt.h3k4 = gTrack('~/DB/Roadmap/consolidated//E114-H3K4me3.pval.signal.bigwig', name = 'H3K4me3', bar = TRUE, col = gray)
gt.enh = gTrack('~/DB/Roadmap/consolidated//E114-H3K27ac.pval.signal.bigwig', name = 'H3K27Ac', bar = TRUE, col = gray)
gt.open = gTrack('~/DB/Roadmap/consolidated//E114-DNase.pval.signal.bigwig', name = 'DNAase', bar = TRUE, col = gray)
gt.rnapos = gTrack('~/DB/Roadmap/consolidated/E114.A549.norm.pos.bw', name = 'RNAseq+', bar = TRUE, col = gray)
gt.rnaneg = gTrack('~/DB/Roadmap/consolidated/E114.A549.norm.neg.bw', name = 'RNAseq-', bar = TRUE, col = gray, y0 = 0, y1 = 1200)

THRESH = 1
seg_data_chrom8_deletions <- seg_data_chrom8_deletions[Log2.Ratio >= -THRESH]
seg_data_chrom8_insertions <- seg_data_chrom8_insertions[Log2.Ratio >= THRESH]
seg_ranges_chrom8_insertions <- dt2gr(seg_data_chrom8_insertions)
seg_ranges_chrom8_deletions <- dt2gr(seg_data_chrom8_deletions)
plot(c(gTrack('~/my_git_packages/super_enhancers/db/ENCFF038AQV.bigWig', color = 'green', bar = TRUE), gTrack(seg_ranges_chrom8_insertions, col = "blue"), gTrack(seg_ranges_chrom8_deletions, col = "red"), ge), win = parse.gr('8:128735434-129641434'))
plot of chunk filter_broad_events
acov = as(coverage(seg_ranges_chrom8_insertions), 'GRanges')
dcov = as(coverage(seg_ranges_chrom8_deletions), 'GRanges')
plot(c(gt.rnapos, gt.enh, gTrack('~/my_git_packages/super_enhancers/db/ENCFF038AQV.bigWig', color = 'green', bar = TRUE), gTrack(acov, 'score', bar = TRUE), gTrack(dcov, 'score', bar = TRUE),  gTrack(seg_ranges_chrom8_insertions, col = "blue"), gTrack(seg_ranges_chrom8_deletions, col = "red"), ge), win = parse.gr('8:128735434-129641434'))+1e6
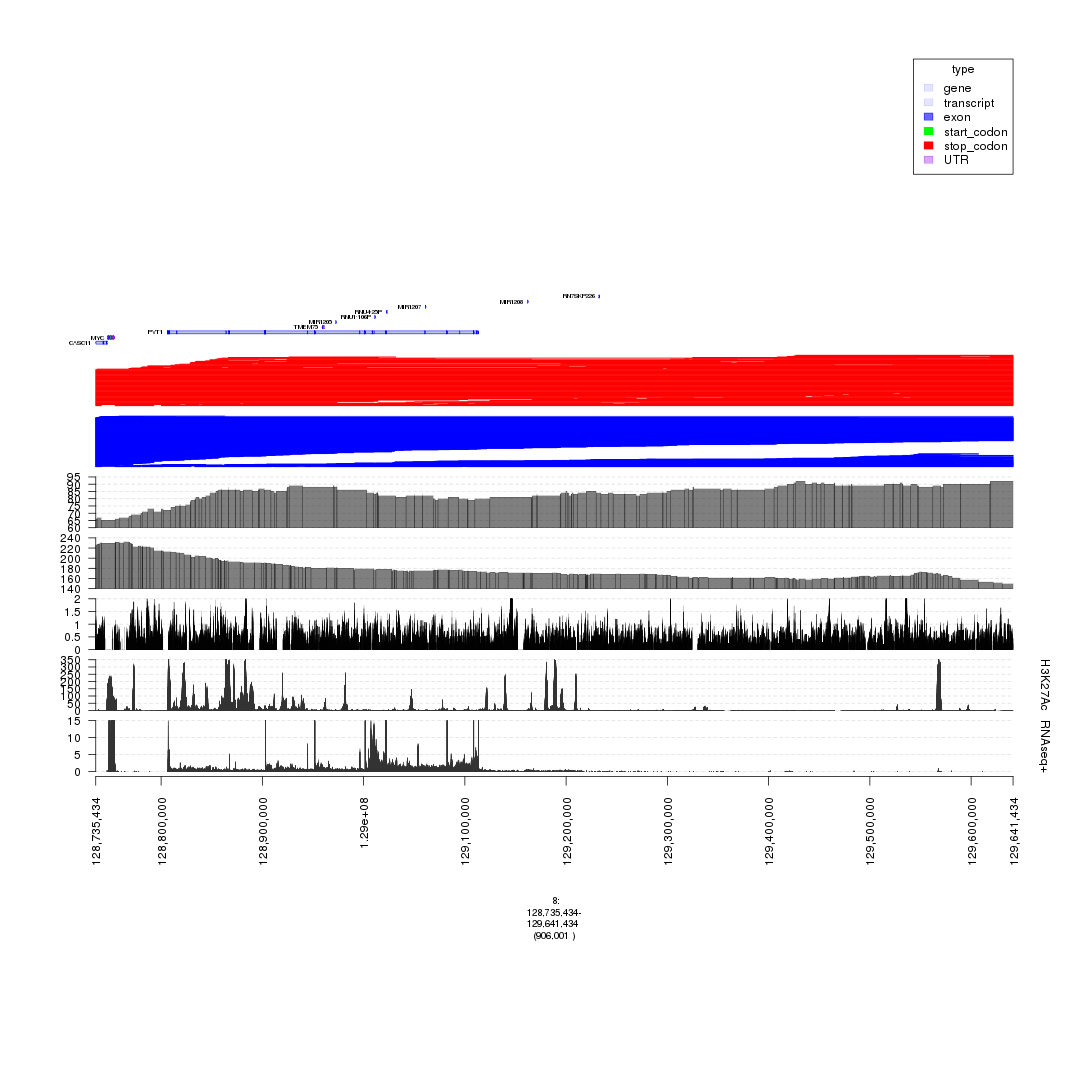
plot of chunk filter_broad_events
## numeric(0)