How to Create Heat Maps
gTrack is able to create heat graphs and in this vignette, the steps to make one will be shown. In order to create one the mdata parameter of gTrack must be supplied a matrix.
mdata Parameter
## DO NOT FORGET TO LOAD gUtils library.
library(gUtils)


## In order to create a heat map for each node in the matrix, color intensity needs to be specified.
## To illustrate, a random N*N matrix filled with values from 1:100 is used, but first a GRanges object is made.

##create an N lengthed GRanges object that you want to have connections.
gr <- GRanges(seqnames = Rle(c("chr1" , "chr2" , "chr1" , "chr3") ,c(1,3,2,4)), ranges = IRanges(c(1,3,5,7,9,11,13,15,17,19) ,end = c(2,4,6,8,10,12,14,16,18,20), names = head(letters,10)),GC=seq(1,10,length=10), name=seq(5,10,length=10))
heatMap = matrix(runif(length(gr)^2), nrow = 10, ncol = 10)
plot(gTrack(gr, mdata = heatMap, stack.gap = 5))
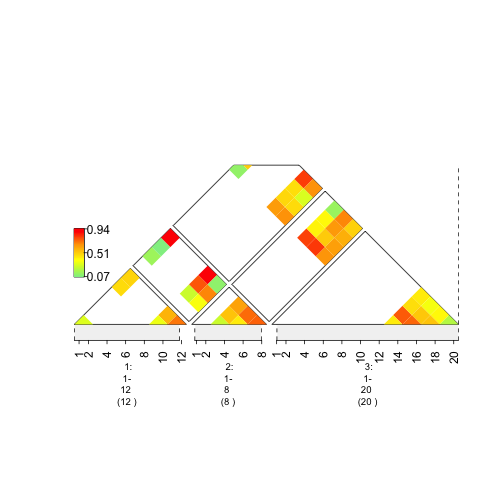
plot of chunk plotheatmap
## It is also possible to add multiple plots to the same window. Use the concatenation operator.
 plot(c(gTrack(gr, edges = graph, stack.gap = 5), gTrack(gr, mdata = heatMap, stack.gap = 5)))
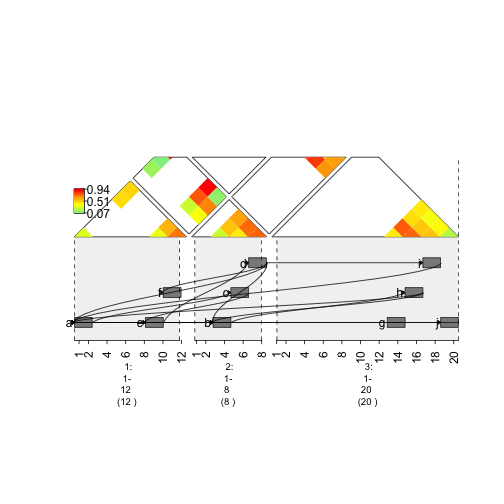
plot of chunk plotheatmap
Zooming In and Out of a Graph
## In order to zoom in and out, essentially the ranges of the sequences need to be stretched or shrinked.
## Firstly, in upstream code, the "seqnames" field of the GRanges object was supplied character vectors. The problem that arises is that the seqlengths of the GRanges object cannot be implicitly determined.
## gUtils can easily fix a GRanges object so that the seqlengths is properly set.
## Use the gr.fix function. It will find the largest coordinate for each seqname and subsequently save those values in the seqlengths parameter.
 gr <- gr.fix(gr)

## create the window for the plot.
 si = si2gr(seqinfo(gr.fix(gr)))
plot(c(gTrack(gr , edges = graph, stack.gap = 5) , gTrack(gr , mdata = heatMap, stack.gap = 5)) , gr.sub(si , 'chr' , '' )+20)
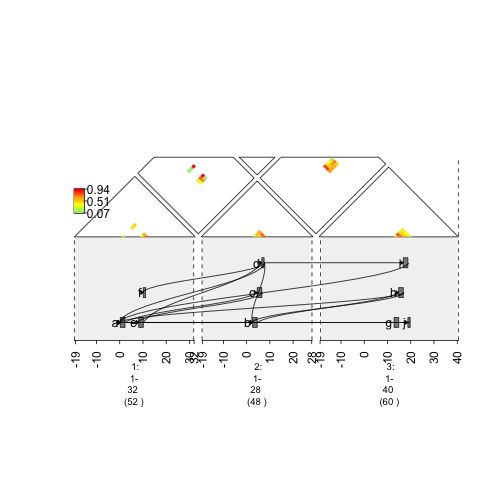
plot of chunk zoomedOutGraph