How To Graph Relationships In The Genome
Genes interact with each other and gTrack is capable of graphing them.
In this vignette, the draw.paths and circle parameters of gTrack will aide in illustrating gene interactions. Specifically, they will be used in graphing variants in random sequences.
Using Draw.paths Parameter
To prepare a data set that illustrates the draw.paths parameter, a GRangesList storing RANDOM sequences in chromosomes 1,2, and 3 is created. Then, two graphs, one with and one without the draw.paths parameter will be made. The difference in the two show the affect the draw.paths parameter has on graphs.
gene1 = sort(sample(gUtils::gr.tile(gUtils::parse.gr('1:1-5e3+'), 50), 5))
gene2 = rev(sort(sample(gUtils::gr.tile(gUtils::parse.gr('2:1-5e3-'), 50), 12)))
gene3 = sort(sample(gUtils::gr.tile(gUtils::parse.gr('3:1-5e3+'), 50), 8))

##Create a column that keeps a counter of the exon number.

gene1$exon = 1:length(gene1)
gene2$exon = 1:length(gene2)
gene3$exon = 1:length(gene3)

## Combine into GRangesList
grl = GRangesList(gene1 = gene1, gene2 = gene2, gene3 = gene3)

gt.genes = gTrack(grl)

## Plot two graphs, one with and one without the draw.paths parameter.
fusion = GRangesList(c(grl$gene1[1:3], grl$gene2[5:9], grl$gene3[7:8]))
gt.fusion = gTrack(fusion, draw.paths = FALSE)
gt.fusion.o = gTrack(fusion, draw.paths = TRUE)

## separating the windows for the graph.
win = gUtils::parse.gr(c('1:1-1e4', '2:1-1e4', '3:1-1e4'))
plot(c(gt.genes, gt.fusion, gt.fusion.o), win +1e3)
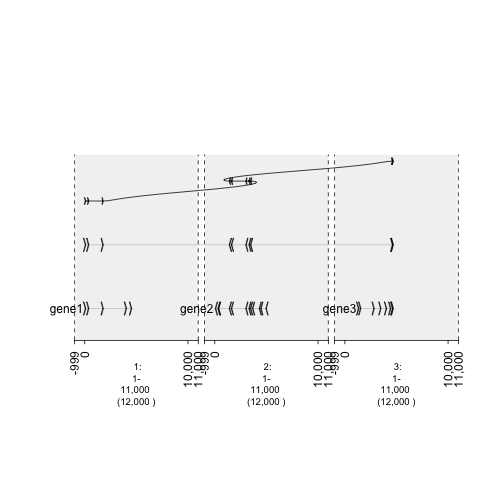
plot of chunk -plotList